JavaScript Code Coverage Tool for Firebug
Warning
This article is old and may contain information that is outdated, irrelevant, or—dare I say it—no longer accurate. Read with care!
Download FirebugCodeCoverage-0.1.xpi
Recently, I’ve become interested in client side automated testing tools. When I found the Selenium plug-in for Firefox, I was blown away. I can record actions in my browser and play them back! No more manual testing of JavaScript code!
Researching a little bit more about automated testing tools led to the discovery of a metric called ‘Code Coverage’, a statistic that gives you a percentage of how much of your code executed during a certain period of time (usually while your automated test was executing).
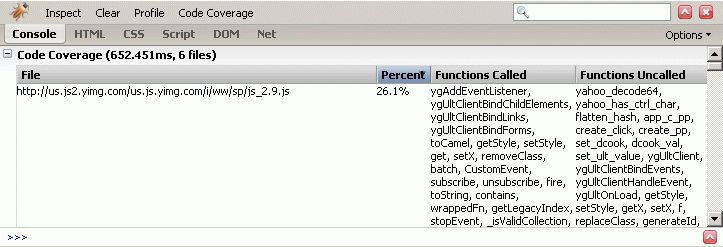
Of course, I immediately thought of Joe Hewitt’s Firebug extension for Firefox, which includes a feature for JavaScript Profiling. The Profile feature of Firebug was similar to a Function Entry Code Coverage report, so I decided to modify the feature and release an add-on for Firefox that showed (at a file level) a list of which functions executed and which functions did not.

So, now, to test my JavaScript code coverage, I will write automated tests using the Selenium IDE plug-in for Firefox, hit the Code Coverage button in Firebug, and try to get my Code Coverage statistics in the upper 90%’s.
Screenshot Example of running the tool at yahoo.com

Download FirebugCodeCoverage-0.1.xpi.
Requirements (obviously)
- Mozilla Firefox
- Firebug Extension for Mozilla Firefox
Limitations:
- Does not include statistics on anonymous functions.
- Is limited to function (entry) code coverage, does not include other forms such as exit, statement, condition, or path code coverage. (Description: Wikipedia)
- Is my first Firefox add-on, so there was a learning curve involved.
Future Improvements:
- Automated integration with Selenium IDE (one button to run tests and do code coverage)
- Better display of results, instead of a big kludge of function names
- Additional types of coverage, depending on what options are available from jsdIDebuggerService
Update: After many requests and much self deliberation, I have decided not to update the plugin to work with newer versions of Firefox. Code Coverage doesn’t belong in the browser, it’s just the wrong place in the tool chain to have something like this. Code Coverage results need to be exportable, and the utility must be executable from the command line to use with unit tests and continuous integration.

18 Comments
Rafael Disqus
29 May 2007Zach Leatherman Disqus
31 May 2007Alex Disqus
12 Jun 2007Aravind Disqus
14 Jun 2007Elephant Disqus
06 Aug 2007Zach Leatherman Disqus
06 Aug 2007David Burns Disqus
09 Aug 2007Zach Leatherman Disqus
10 Aug 2007Mike Cole Disqus
20 Sep 2007Jokin Disqus
14 Nov 2007Zach Leatherman Disqus
15 Nov 2007Zach Leatherman Disqus
30 Mar 2008Daniel Colascione Disqus
08 Jan 2009Zach Leatherman Disqus
08 Jan 2009VELO Disqus
08 Jun 2009Aaron T. Grogg Disqus
22 Jun 2009well Disqus
14 Sep 2009Zach Leatherman Disqus
31 Dec 2009