Maiden Voyage of the DOM Sailbloat

As many of you may already know, my day job includes managing a large and complex enterprise jQuery-based user interface component library. It’s used by all new web applications at the company, which boasts over an IT department of approximately 1500 people and hundreds of web applications. Needless to say, I get a fair volume of interesting support tickets that come my way. A few weeks ago, I had the pleasure of receiving one such ticket.
The support ticket’s symptoms included a oft-heard complaint: poor performance. On the web, poor performance can be attributed to a great many things, but most often can be boiled down to a bottleneck in JavaScript code using the DOM API. This time, strangely enough, the culprit was something else entirely.
One of the first things I check when an application complains of poor performance is the total size of the document, or how many nodes it has. One of the best ways to ensure good performance is to keep your document small, especially on projects using heavy dynamic element selection and filtering (think jQuery, Mootools, Prototype, Dojo, or any code using a selector engine like Sizzle). Any JavaScript library emulating CSS selectors executing over a very large document is going to take quite a bit longer than querying a small document, especially when the user’s browser doesn’t support native querySelector or getElementsByClassName.
To get an idea of what the size of a large document is, I usually go to a site with some fairly advanced JavaScript and query their size.
// Returns the total number of nodes in the document document.getElementsByTagName('*').length; // note: this number will not include any child nodes inside of iframes.
| URL | Total Element Count |
|---|---|
maps.google.com |
731 |
my.yahoo.com |
1508 |
calendar.google.com (Authenticated) |
681 |
reader.google.com (Authenticated) |
4866 |
Getting back to the support ticket in question. After querying the document, I quickly found that the page contained over 50000 nodes. Wow. So, we’ve caught a big one. You’re going to be telling your grandkids about this some day. But, now what?
I decided it would be beneficial to find out where and what all of those nodes were. After clicking around the live document in the Firebug’s HTML tab for awhile, looking at View Source, and Ajax requests in the Console, I successfully determined the culprit. This particular application was using Wicket, a popular Java library for web applications, which includes its own Ajax Logger component (similar to my favorite log4javascript; or something like the YUI Logger), used to keep track of an application’s Ajax calls and JavaScript page manipulations with an inline GUI embedded in the parent document. On one page load, this application’s Ajax logger component had created 40000 nodes of log content.
It’s important to realize that embedding unnecessary content of that magnitude on the page can be very detrimental to performance. JavaScript loggers should log to a new child window, rather than be embedded in the parent document. This way they won’t bloat the document, but still provide you with much needed logging information.
But, in the future, how might this type of problem be more easily diagnosed and prevented? Ideally, when confronted with large documents, we want to see where in the document the majority of those nodes are located. But there isn’t an easy way to see which portion of the document is using the largest number of nodes, especially if the culprit is deep into the document tree. We can go through the source code manually, but that isn’t very efficient.
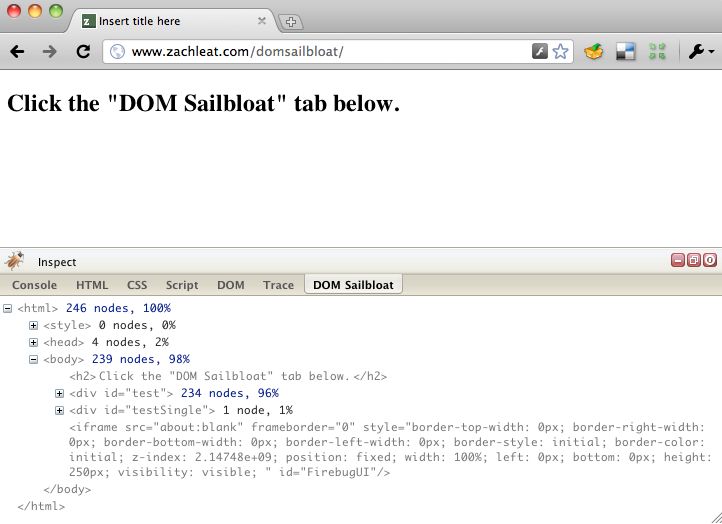
So in the spirit of exploratory development to help troubleshoot real-world problems, I decided to make a Firebug Lite plugin. This would give me an easy cross-browser tool to diagnose my problem in a familiar interface. Load up Firebug Lite, load the DOM Sailbloat JavaScript file, and easily spot the HTML love handles.
Here’s what it looks like in action:

Go Forth
Note: there is currently an undiagnosed issue with the Sailbloat and it fails to load intermittently. If you know why, I’d be happy to put your name in the source code credits.


1 Comment
Pedro Simonetti Disqus
21 Jul 2010