
Use Speedlify2 to Continuously Measure Website Performance
Benchmark the performance and accessibility of websites over time.
speedlify.dev GitHub (Template) 0%- Age
- Updated
- Issues
-
5
5 - PRs
-
0
2
speedlify2-score
A zero-dependency web component showing Lighthouse scores for a URL, published by a speedlify2 instance.
GitHub npm- Versions
- 2 versions in1.1.0
New - Audit
-
0 reports
0 deps - Issues
-
5
5 - PRs
-
0
2
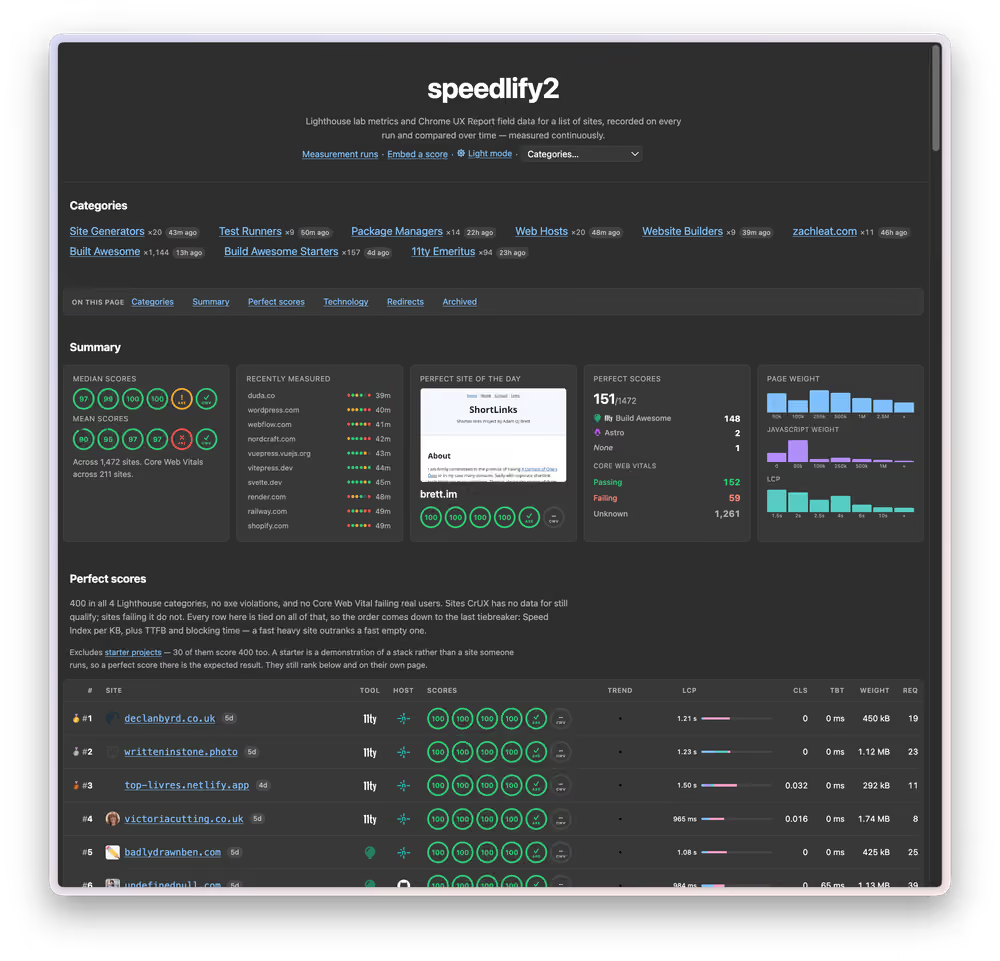
speedlify.dev, now running Speedlify2.
The year is 2020. Inspired by a lack of budget for a web performance monitoring tool, the original Speedlify project (Speedlify Classic) was shipped to continuously measure site performance. It ran Lighthouse against a predetermined list of sites and ranked their performance against each other. Over time, I started to add a few more things to Speedlify.
- A
<speedlify-score>Web Component was added to show scores on your web site. - The Eleventy Leaderboards were migrated to use Speedlify, running 31 unique contests and testing 1208 unique websites.
As the Leaderboards grew, the work involved in maintaining them scaled similarly. Due to infrastructure build time constraints (a 15 minute build limit) and limitations in how Speedlify executed its measurement step (all sites would run serially and a compare step ran when all measurements had been taken), the Leaderboards needed to run on my own hardware.
Over six years, it’s pretty natural that some folks would let their websites and domains lapse. A few sites moved away to use other tools. All of which culminated in manual work to publish Leaderboard scores. You could probably see this reflected in how often the Leaderboards were published 🫣 — though in retrospect 31 runs in six years (~2 month cadence on adverage) isn’t bad!
Better and more Automated
Regardless, I’m delighted to show off some huge updates and improvements have been made to the brand new Speedlify2. Changes which will ultimately save me a bunch of time and effort!
- Speedlify2 is now measuring 1565 sites continuously without requiring any manual work.
- Each category has its own cadence configuration, and the Built Awesome category is currently configured to visit sites once per week to measure and test.
- Everything is static and self contained, deployable via GitHub Actions to GitHub Pages. You can easily deploy your own Speedlify2. (Run the reset script to start from scratch)
- Measurements happen in small chunks in parallel on GitHub Actions. The measurement step is now decoupled from ranking. When the site builds, it pulls from the newest measurements for all steps and ranks them. This is far more robust!
- Sites that move away from Build Awesome (11ty) are now automatically put into an unranked Emeritus category. I went ahead and backfilled the 92 websites that have moved away since we started the showcase in 2018. Emeritus sites can show up on the Perfect Scores ranking on the home page (though at time of writing only 3 of the 92 of them do).
- Instead of the classic 4-circle Lighthouse design, this adds additional circles for Core Web Vitals (field data alongside lab data) and now explicitly shows the output of a more detailed and rigorous Axe CLI run. Lighthouse does use Axe internally but doesn’t report everything (Speedlify2 does).
- Adds a new
<speedlify2-score>component. - The production service has backwards API compatibility with any legacy
<speedlify-score>components using the old speedlify.dev instance as their data source (and all sites measured there are measured on the new speedlify.dev). - Categories are no longer mutually exclusive. URLs can exist in multiple categories and the home page shows all of the perfect scoring sites across all categories. To avoid extra testing traffic, single measurements are re-used across categories.
- Adds a new randomly selected Perfect Site of the Day.
It might be interesting to look at the report of Speedlify measuring Speedlify, which includes measurements before the production domain was moved from Speedlify (classic) to Speedlify2. We can see how the migration went!
No-JavaScript Comparisons
Speedlify2 also shows screenshots for No-JavaScript and JavaScript-enabled, reporting the visual percentage difference between the two. This does not feeding into rankings (as it isn’t a foolproof measure) but it does have utility!
Specifically, it can reveal sites that exclusively use client side rendering (solidjs.com at ∆ 77.4%):

It can reveal sites that may have bugs in their dark/light mode switcher (nuxt.com at ∆ 99.8%):

It can reveal sites that use an announcement bar that causes the entire page to layout shift (svelte.dev at ∆ 36.2%):

Highlighting Good Sites
The Built Awesome Leaderboards are intended to be a very rigorous and competitive leaderboard. The sites that score well here are very fast.
But (similarly to the Eleventy Leaderboards before them) we don’t highlight bad scores. The (exhaustively long) list is exclusive to sites with all green circles. With an exception for unknown Core Web Vitals, which requires a level of minimum production traffic in Chrome browsers to show data.
Sites with yellow or red circles are shown in an overflow list (randomly ordered) with no scores visible. You can navigate through to check your site’s page individually and review the report to learn how you can improve for the next run.
The other top level categories (Web Hosts, Site Generators, Website Builders, Package Managers et al) are for corporate accountability and do show poorly scoring sites. This is a separate tact we want to avoid for personal or individual websites. We can and should hold professional and paid websites to a higher standard!